Ubuntu 查看 CPU 和 GPU
GPU
GPU 占用率高好,CPU 占用率高不好 CPU 是多任务环境应用(要跑系统,要跑程序,背景可能还要有其他任务,读盘,分配资源等);GPU 是单任务环境应用,只有图形计算一个工作(对用户来说,一次运行一个游戏或者一个 dl 训练任务),且帧数是没有上限的,帧率越高体验越好。所以 CPU 占用越低越可以给其他任务留出性能冗余,保证整体反应速度和流畅性。GPU 利用率越高效率越高,让它尽量一直干活
查看 GPU 占用:
nvidia-smi1
2
3
4
5
6
7
8
9
10
11
12
13
14
15
16
17
18
19
20
21
22
23
24root@e232f:/home/# nvidia-smi
Mon May 30 02:45:53 2022
+-----------------------------------------------------------------------------+
| NVIDIA-SMI 510.68.02 Driver Version: 510.68.02 CUDA Version: 11.6 |
|-------------------------------+----------------------+----------------------+
| GPU Name Persistence-M| Bus-Id Disp.A | Volatile Uncorr. ECC |
| Fan Temp Perf Pwr:Usage/Cap| Memory-Usage | GPU-Util Compute M. |
| | | MIG M. |
|===============================+======================+======================|
| 0 NVIDIA GeForce ... Off | 00000000:3B:00.0 Off | N/A |
| 0% 30C P8 21W / 350W | 2189MiB / 12288MiB | 0% Default |
| | | N/A |
+-------------------------------+----------------------+----------------------+
| 1 NVIDIA GeForce ... Off | 00000000:AF:00.0 Off | N/A |
| 30% 26C P8 17W / 350W | 2195MiB / 24576MiB | 0% Default |
| | | N/A |
+-------------------------------+----------------------+----------------------+
+-----------------------------------------------------------------------------+
| Processes: |
| GPU GI CI PID Type Process name GPU Memory |
| ID ID Usage |
|=============================================================================|
+-----------------------------------------------------------------------------+第一行:NVIDIA-SMI 版本, 已经安装的 NVIDIA 驱动版本,已安装驱动可以支持的最新的 CUDA 版本,新的驱动可以支持旧版本的 CUDA。 注:这里并不能说是否安装了 CUDA
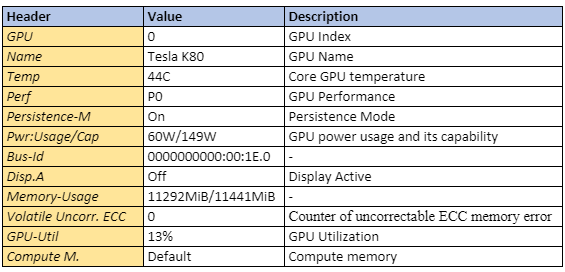 GPU: GPU index fan: Fan speed (0%-100%), N/A
means no fan
GPU: GPU index fan: Fan speed (0%-100%), N/A
means no fan查看 GPU 编号:
nvidia-smi -L1
2
3root@e2a435:/home/# nvidia-smi -L
GPU 0: NVIDIA GeForce RTX 3080 Ti (UUID: GPU-42432a6b-5820-e116-181b-cfd5c9c2d35e)
GPU 1: NVIDIA GeForce RTX 3090 (UUID: GPU-9c3bdbff-5619-1d07-579d-e5892c950959)结合 watch 刷新
watch -n 60 -d nvidia-smi-n: 指定刷新秒数,-d: 高亮变化的地方
CPU
lscpu 查看 CPU 信息
1 | lscpu |
“CPU(s): 96” represents the number of logical cores, which equals “Thread(s) per core” × “Core(s) per socket” × “Socket(s)”. One socket is one physical CPU package (which occupies one socket on the motherboard); each socket hosts a number of physical cores, and each core can run one or more threads.
In my case, I have two sockets, each containing a 24-core Xeon 8259CL CPU, and since that supports hyper-threading with two threads, each core can run two threads.
总核数 = 物理 CPU 个数 X 每颗物理 CPU 的核数 总逻辑 CPU 数 = 物理 CPU
个数 X 每个物理 CPU 的核数 X 超线程数 查看物理 CPU 个数:
cat /proc/cpuinfo| grep "physical id"| sort| uniq| wc -l
查看每个物理 CPU 中 core 的个数(即核数):
cat /proc/cpuinfo| grep "cpu cores"| uniq
查看逻辑 CPU 的个数:
cat /proc/cpuinfo| grep "processor"| wc -l
查看 CPU 型号:
cat /proc/cpuinfo | grep name | cut -f2 -d: | uniq -c
htop 查看进程的 CPU 使用信息
htop 主要有三部分:
Header:主要包括 CPU, Memory, Swap 占用和 tasks, load average, Up-Time
Color coding for CPU
- Green – Amount of CPU consumed by the user’s processes.
- Red – Amount of CPU used by system processes.
- Grey – Amount of CPU used for Input/Output based processes.
tasks: 当前任务/进程数;线程数;当前任务中处于运行状态的任务数
load average:load average 后面的三个数分别是 1 分钟、5 分钟、15 分钟的平均负载情况。
Uptime – Amount of time since the last system reboot.
uptime命令也可以查看1
2uptime
12:17:58 up 111 days, 31 min, 1 user, load average: 0.00, 0.01, 0.05按照 CPU 利用率排序的进程列表
相关快捷键命令 按
q:退出 按t: 以进程树 tree 形式显示进程信息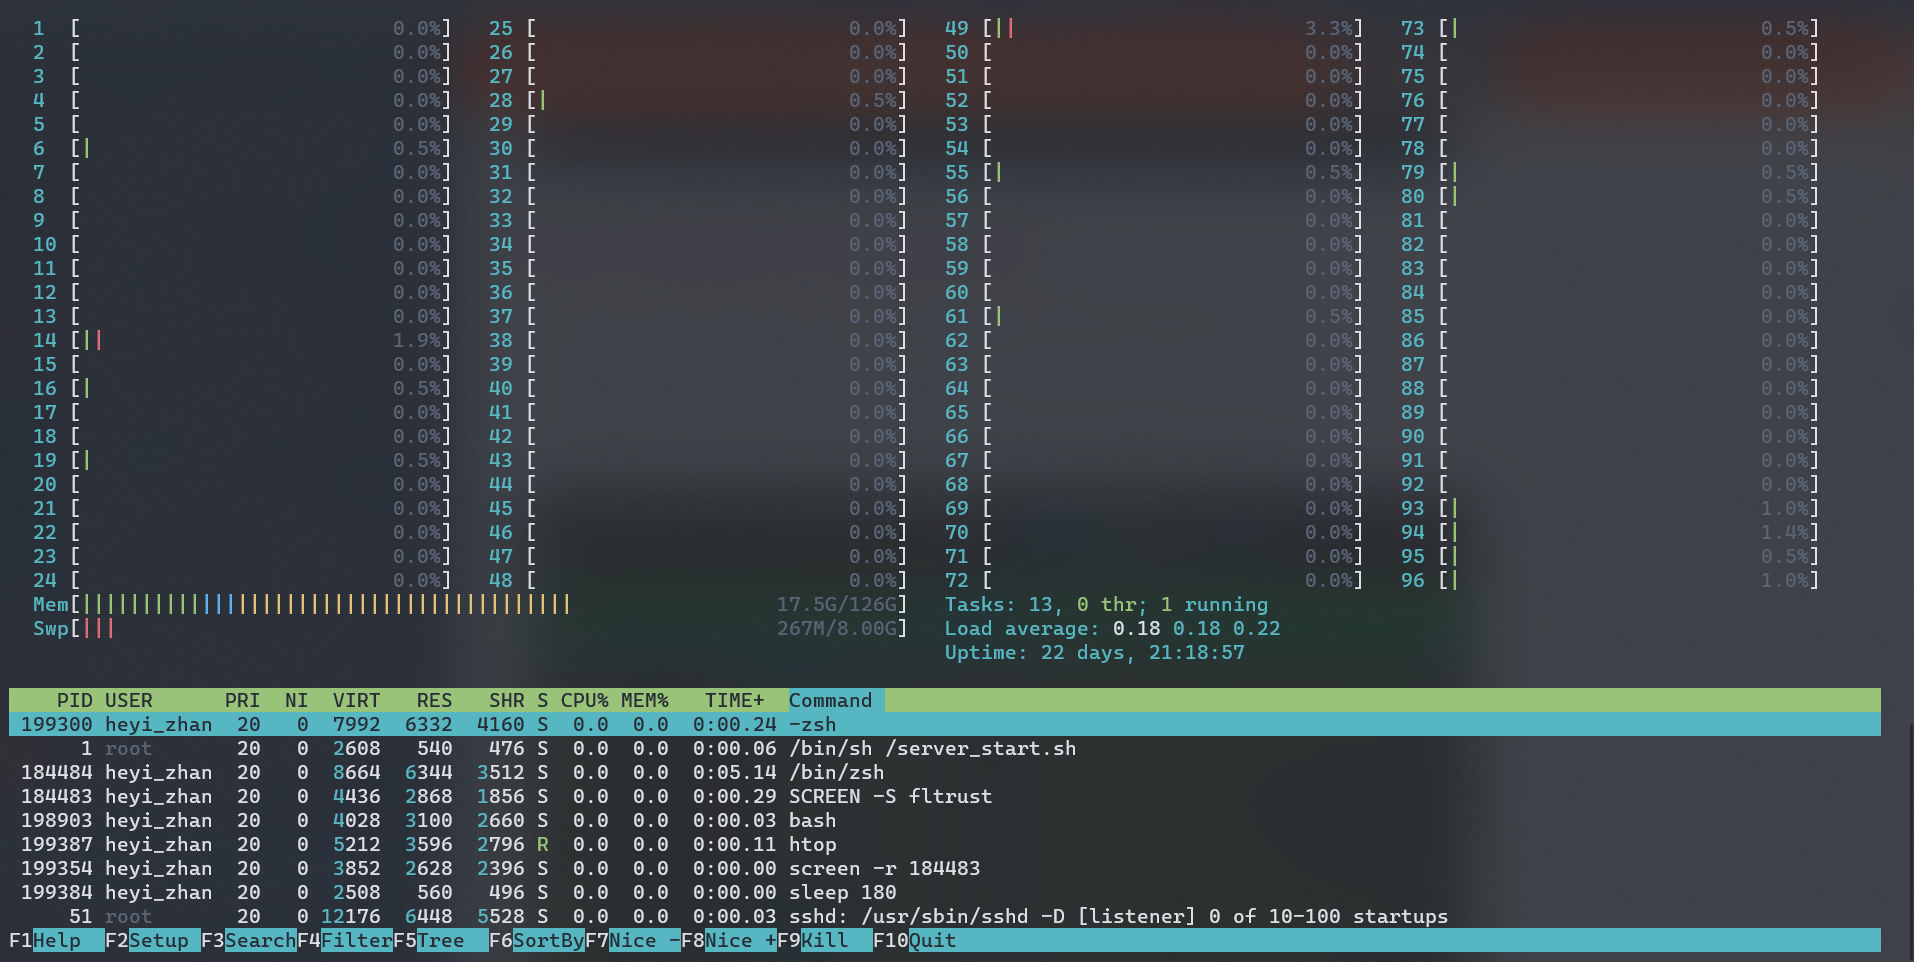
CPU 利用率超过 100%的现象:top/htop 命令是按 CPU 总使用率来显示的,24 核理论上最高可达 2400%